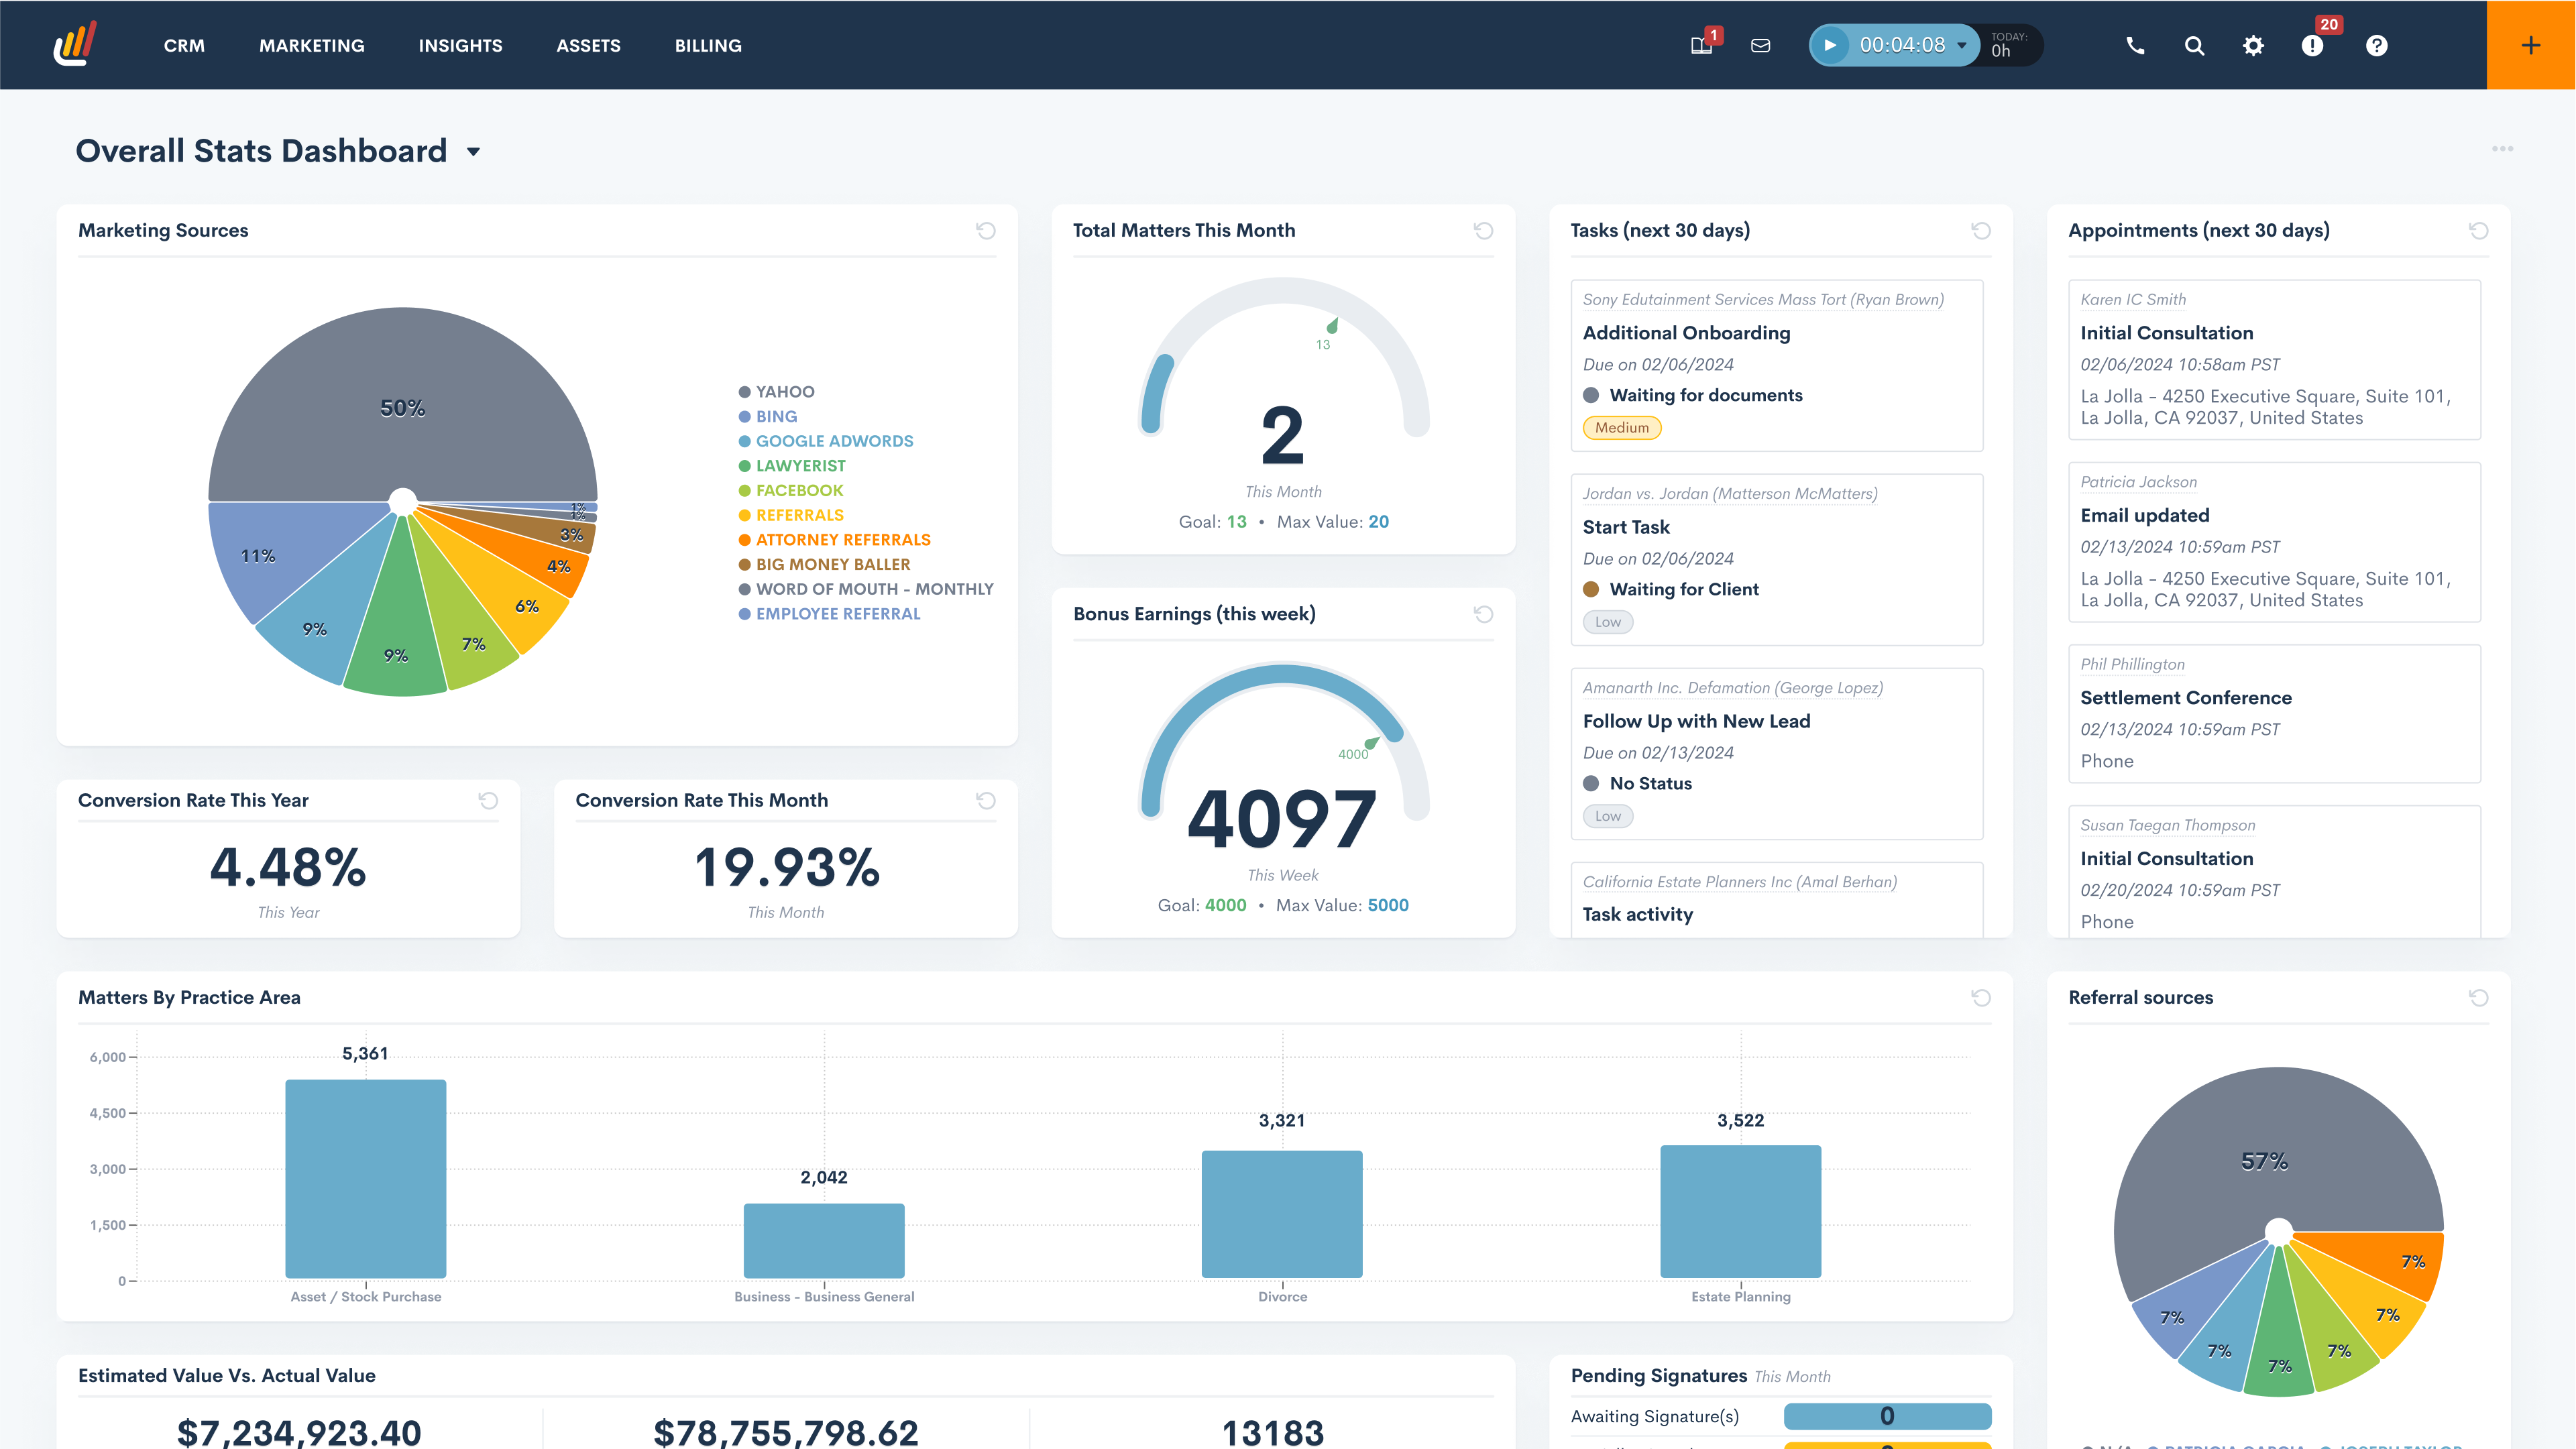
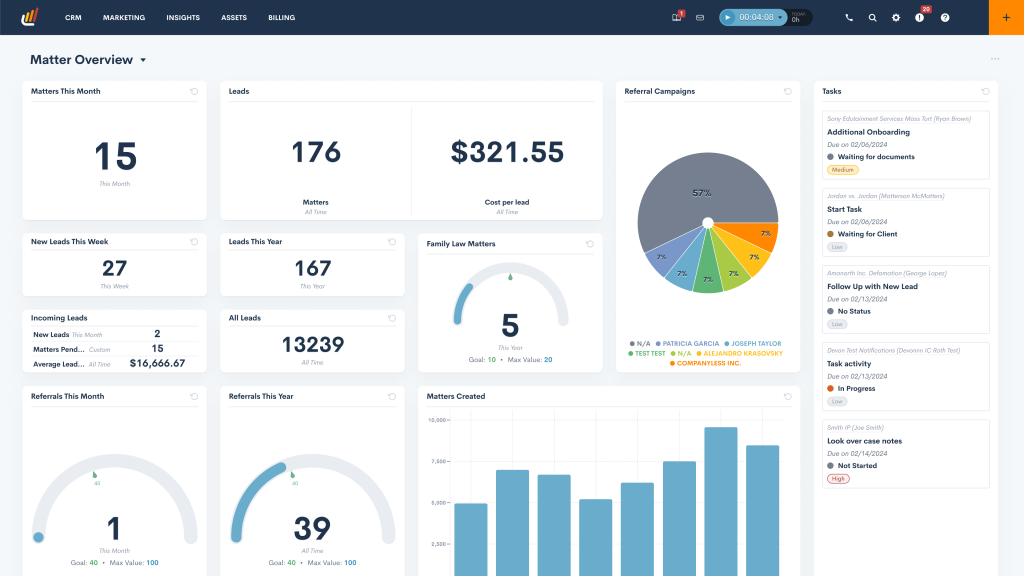
As a cloud-based CRM and marketing platform for law firms, Lawmatics has always featured a standard dashboard where users can get an at-a-glance overview of their activity and metrics. But now, the company has introduced custom dashboards, enabling firms to create their own unique dashboards showing the precise data they wish to track.
Matt Spiegel, founder and CEO, says his goal is for Lawmatics to become the Salesforce of law — legal professionals’ de facto source of truth for anything related to their clients and contacts — and that key to that is allowing users to slice and dice and visualize their data however they want.
“We’ve been talking about this in the legal industry for, I don’t know, at least 15 years, about the power of your data and the importance of KPIs and of being able to analyze it, but, until now, no one has really given you the ability to really dive into your data in this way,” Spiegel said.
With this new custom dashboards feature, firms can not only choose from an array of standard graphs and charts and and arrange them in whatever layout they like, but they can also create and display custom reports that filter data so that their dashboards show exactly the information they want to track.
For example, Lawmatics provides standard metrics for items such as new leads, conversion rates, and cost per lead, any of which can be included in a custom dashboard. But perhaps the firm wants the dashboard to include a chart specifically showing sources of leads. In just a few clicks, the firm can create a simple custom report showing this data and then select how and where to display it on the dashboard.
This ability to create and edit dashboards is limited to those within the firm who have admin access or who have been specifically given permission by an admin. But firms can create multiple dashboards and tailor them to specific types of users within the firm, so perhaps someone in business development has one dashboard while someone doing intake has another.
Creating Custom Dashboard
For those with access, the process of creating a custom dashboard starts from the standard dashboard, where a “Create Panel” button lets them begin building the elements.
The user begins by selecting from one of the four types of panels they can add to the dashboard:
- Text, for adding any kind of text to the dashboard, from a standard reminder to an inspirational quote.
- Section Header, for labeling the different sections of the dashboard.
- Data Panel, for creating the components that pull and display data.
- Group, for linking multiple panels so that they stay and move together on the dashboard and the user drags and drops them to customize the layout.
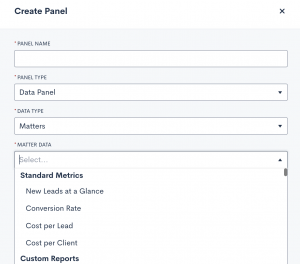
The meat of this is the data panels the user can create. To do this, the user opens the Create Panel interface, gives the panel a name, chooses “Data Panel” as the type of panel to create, and then chooses the data type.
Standard options for data metrics include matters, e-signatures, appointments, tasks, time entries, and invoices. Selecting matters provides the most options for customization, as this is where the user can select from standard metrics or from their own custom reporting metrics.
(While the ability to create custom reports is not new within Lawmatics, what is new is the ability to visually display data from these reports on the dashboard.)
The user can also select the date range for the metrics and how the metrics should be displayed. Options include a pie chart, a bar chart, by values, or as a gauge measured against a specific goal.
This ability to display custom metrics is what Spiegel believes is the “incredible value” of this feature. While many platforms will “spoon feed you” standard metrics, this ability to create your own custom metrics is unique, he said.
“Here in our dashboard, where we’ve unleashed just incredible power is in our ability to take your custom reports that you’ve built and create visualizations from the custom reports.”
The feature is available only for Lawmatics customers on the Team pricing tier and above.
 Robert Ambrogi Blog

